
FII HATRIUM
ATSA11
General
Fund type: FII
Shoppings
Operation start: Oct 8, 2018
26.843.225/0001-01
07.253.654/0001-76
Portfolio
Current properties: 1
Area: 33,232.3 m2
Occupancy: 84.19%
Unknown geography: 0
Fund portfolio1 properties
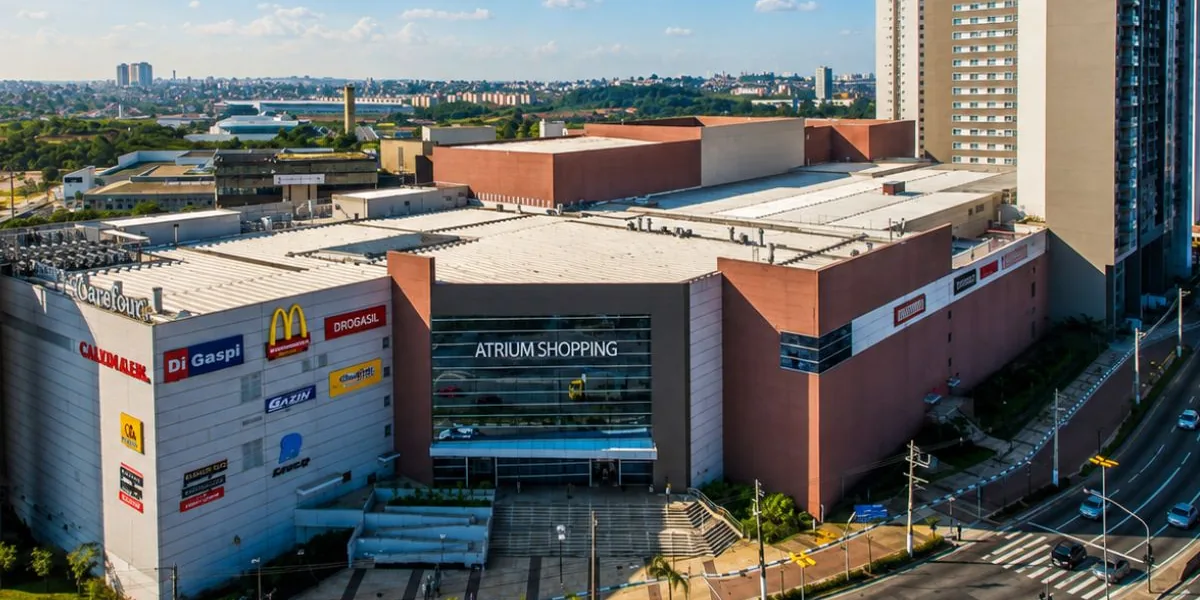
Current propertiesAtrium Shopping Santo André - 100%
1/1
Geographic distribution
SPSão Paulo100% (1 imóveis)
Vacancy
15.81%Period
Scale
Contract maturity
Contract indexers
Price
PriceR$60.00
Close · Oct 30, 2026Shareholders: 302
NAV per shareR$74.43
Share priceR$60.00
Current discount+R$14.43
-19.38% below NAV
Below NAV
The fund is trading at a discount relative to its net asset value.
Market price
R$60.00Period
Series
Daily liquidity
R$5.3KPeriod
Scale
View sources and calculation
Published snapshot values, not real-time quotes. Price and net asset value dates may differ. Missing data does not mean zero; past yield does not predict future income.
Unadjusted closing price: R$60.00 · Reference:
Price-to-book ratio: Price used in calculation: R$60.00 (adjusted for corporate actions), . Net asset value per share: R$74.426019, .
Comparisons
Benchmark comparison
Cumulative evolution of an initial investment comparing the fund with the available benchmarks. Initial investment: R$1,000.00
Fund
CDI
IPCA
IFIX
1 year benchmark comparison
R$1,172.19Peer comparison
See how the fund compares with the average FIIs in the selected scope.
Scope
12M yield
Fund: 6.12%Peer average: 22.33%
Pays below 72.6% than the peer averageP/B
Fund: 0.81Peer average: 2.36
Trades below 65.9% than the peer averageNAV per share
Fund: R$74.43Peer average: R$368.76
NAV per share below 79.8% than the peer averageNet equity
Fund: R$130.3MPeer average: R$536.2M
75.7% below the peer averagePrice and yield against peers
Compares income, price-to-book and NAV per share.12M yieldPays below 72.6% than the peer average
ATSA11: 6.12%Peer average: 22.33%
P/BTrades below 65.9% than the peer average
ATSA11: 0.81Peer average: 2.36
NAV per shareNAV per share below 79.8% than the peer average
ATSA11: R$74.43Peer average: R$368.76
Balance sheet size
Shows the fund scale relative to peers in the selected scope.75.7% below the peer average
Dividends
DY (12M)6.12%
Stated payment date: Nov 16, 2026
DY(VP): 0.27%
Close
View sources and calculation
Published snapshot values, not real-time quotes. Price and net asset value dates may differ. Missing data does not mean zero; past yield does not predict future income.
Dividend yield for the 12-month window: Reported window: — . Distributions per share in window: R$3.67. Price used in calculation: R$60.00 (unadjusted), .
Getting started with FIIs (Portuguese) · Understanding monthly FII income (Portuguese)
Latest announced distribution · Announcement
Event reference: Oct 30, 2026 · Announcement: Oct 30, 2026 · Stated payment date: Nov 16, 2026
AnnouncementSelected verifiable events; not the complete history or confirmation of settlement.
Income calculator
Estimated monthly incomeR$33.33
Estimated annual incomeR$611.67
Estimated shares166.67
Magic number
Share priceR$60.00
Latest announced distributionR$0.20
Required shares300
Estimated total to generate 1 new shareR$18,000.00
Monthly dividends
Period
Scale
Monthly dividend yield
Period
Scale
Dividend eventsEvents available in this publication, ordered by reference date; the list may be limited and is not a complete history.
Selected verifiable events; not the complete history or confirmation of settlement.
Total48
Showing48
Page1/8
Filters by reference, payment, or delivery date.
R$0.20Announcement
Tax statusTax exempt
R$0.20Announcement
Tax statusTax exempt
R$0.20Announcement
Tax statusTax exempt
R$0.20Announcement
Tax statusTax exempt
R$1.20Announcement
Tax statusTax exempt
R$0.15Announcement
Tax statusTax exempt
R$0.15Announcement
Tax statusTax exempt
R$0.15Announcement
Tax statusTax exempt
R$0.15Announcement
Tax statusTax exempt
R$0.15Announcement
Tax statusTax exempt
R$0.77Announcement
Tax statusTax exempt
R$0.15Announcement
Tax statusTax exempt
R$0.15Announcement
Tax statusTax exempt
R$0.15Announcement
Tax statusTax exempt
R$0.15Announcement
Tax statusTax exempt
R$0.15Announcement
Tax statusTax exempt
R$0.53Announcement
Tax statusTax exempt
R$0.12Announcement
Tax statusTax exempt
R$0.12Announcement
Tax statusTax exempt
R$0.12Announcement
Tax statusTax exempt
R$1.03Announcement
Tax statusTax exempt
R$0.50Announcement
Tax statusTax exempt
R$0.72Announcement
Tax statusTax exempt
R$0.05Announcement
Tax statusTax exempt
R$0.05Announcement
Tax statusTax exempt
R$0.05Announcement
Tax statusTax exempt
R$0.05Announcement
Tax statusTax exempt
R$0.05Announcement
Tax statusTax exempt
R$0.05Announcement
Tax statusTax exempt
R$0.05Announcement
Tax statusTax exempt
R$0.25Announcement
Tax statusTax exempt
R$0.25Announcement
Tax statusTax exempt
R$0.31Announcement
Tax statusTax exempt
R$0.25Announcement
Tax statusTax exempt
R$0.25Announcement
Tax statusTax exempt
R$0.35Announcement
Tax statusTax exempt
R$0.40Announcement
Tax statusTax exempt
R$0.20Announcement
Tax statusTax exempt
R$0.61Announcement
Tax statusTax exempt
R$0.30Announcement
Tax statusTax exempt
R$0.30Announcement
Tax statusTax exempt
R$0.00Announcement
Tax statusTax exempt
R$0.00Announcement
Tax statusTax exempt
R$0.10Announcement
Tax statusTax exempt
R$0.31Announcement
Tax statusTax exempt
R$0.15Announcement
Tax statusTax exempt
R$1.50Announcement
Tax statusTax exempt
R$0.10Announcement
Tax statusTax exempt
Financial
Net equity
R$130.3MPeriod
Receivables
R$1.3MPeriod
Scale
Cash position
R$4.3MPeriod
Scale
Payables
R$434.6KPeriod
Scale
Documents
Management report
Monthly preview
O NOI do Atrium Shopping Santo André foi de R$ 1.004.624 em agosto, alta de 53,8% frente a agosto de 2025; a gestão atribui o avanço ao desempenho do cinema, que impulsionou aluguel complementar e receita de estacionamento.
Dec 9, 2025, 7:03 PM
Oct 13, 2026, 5:42 PM
Segment: Shoppings
Relevant notices and management reports published by the fund.
Material factsPaginated list of the most recent material facts published by the fund.
Total24
Showing24
Page1/5
Filters by published or reference date.
Material fact
Material fact
Material fact
Material fact
Material fact
Management reportsPaginated list of the most recent management reports published by the fund.
Total24
Showing24
Page1/5
Filters by published or reference date.
Management report
Management report
Management report
Management report
Management report